us.jpg fr.jpg

info@bourbonfm.com
(+1) 312 909 6539

facebook.png linkedin.png 01113281ebb7dfb57a8dc2a02eb1cb92.png_srz_26_26_85_22_0.50_1.20_0.00_png_srz.png e83942d98df1989e10269ad67034ea34.png_srz_26_26_85_22_0.50_1.20_0.00_png_srz.png    

Charts for a better perspective

us.jpg   fr.jpg

The BFM team wishes you and your families a Happy, Healthy, Prosperous, and Fulfilling New Year!


Charts to Give You a Better Global Perspective After the Worst December


I. Stock markets performance update: 2018 was not a good year

II. U.S. Stocks and the S&P 500 Index: December 2018 was the worst December

III. Valuations: getting better

IV. Economy: a recession in 2020-2021?


I. Stock markets performance update: 2018 was not a good year
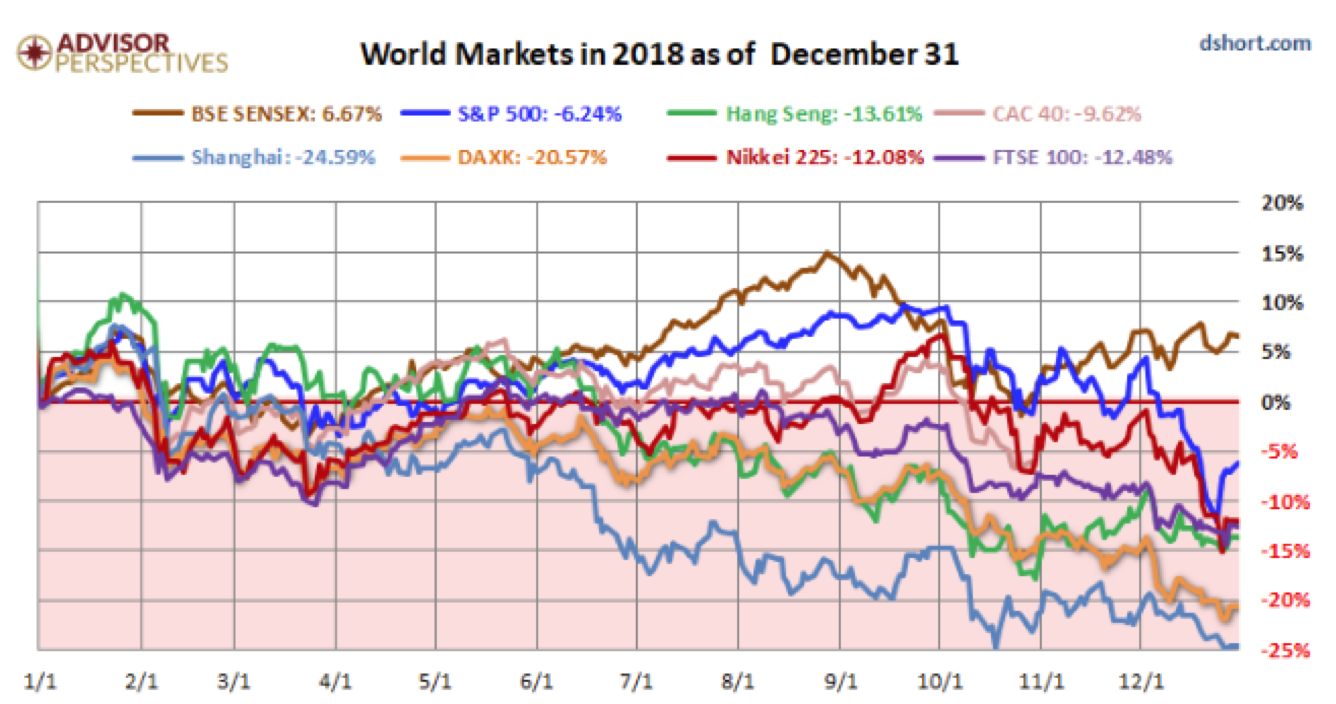


World Markets in 2018 as of Decemeber 31.png

2018_A Historically Bad Year.png

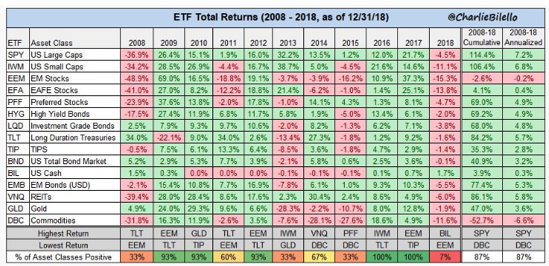
ETF Total Returns Since 2008.png

Record Share of Asset Classes Posting Negative YTD Returns Since 1905.PNG

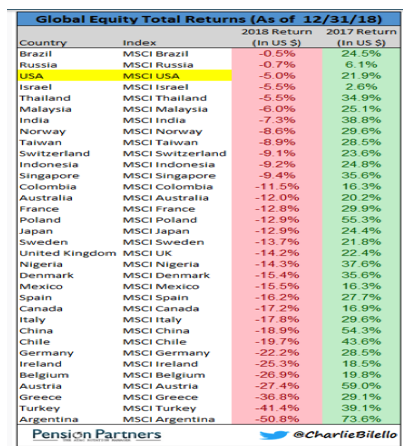
Global Equity Total Returns.png

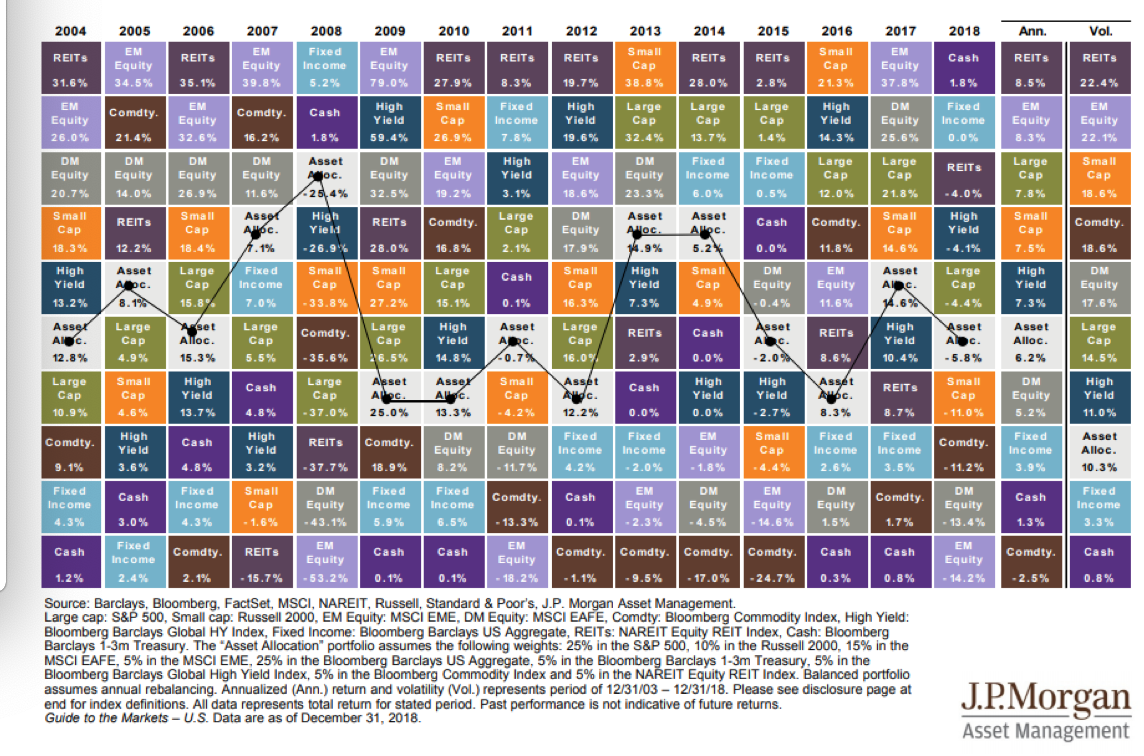
Asset Allocation Since 2004.png


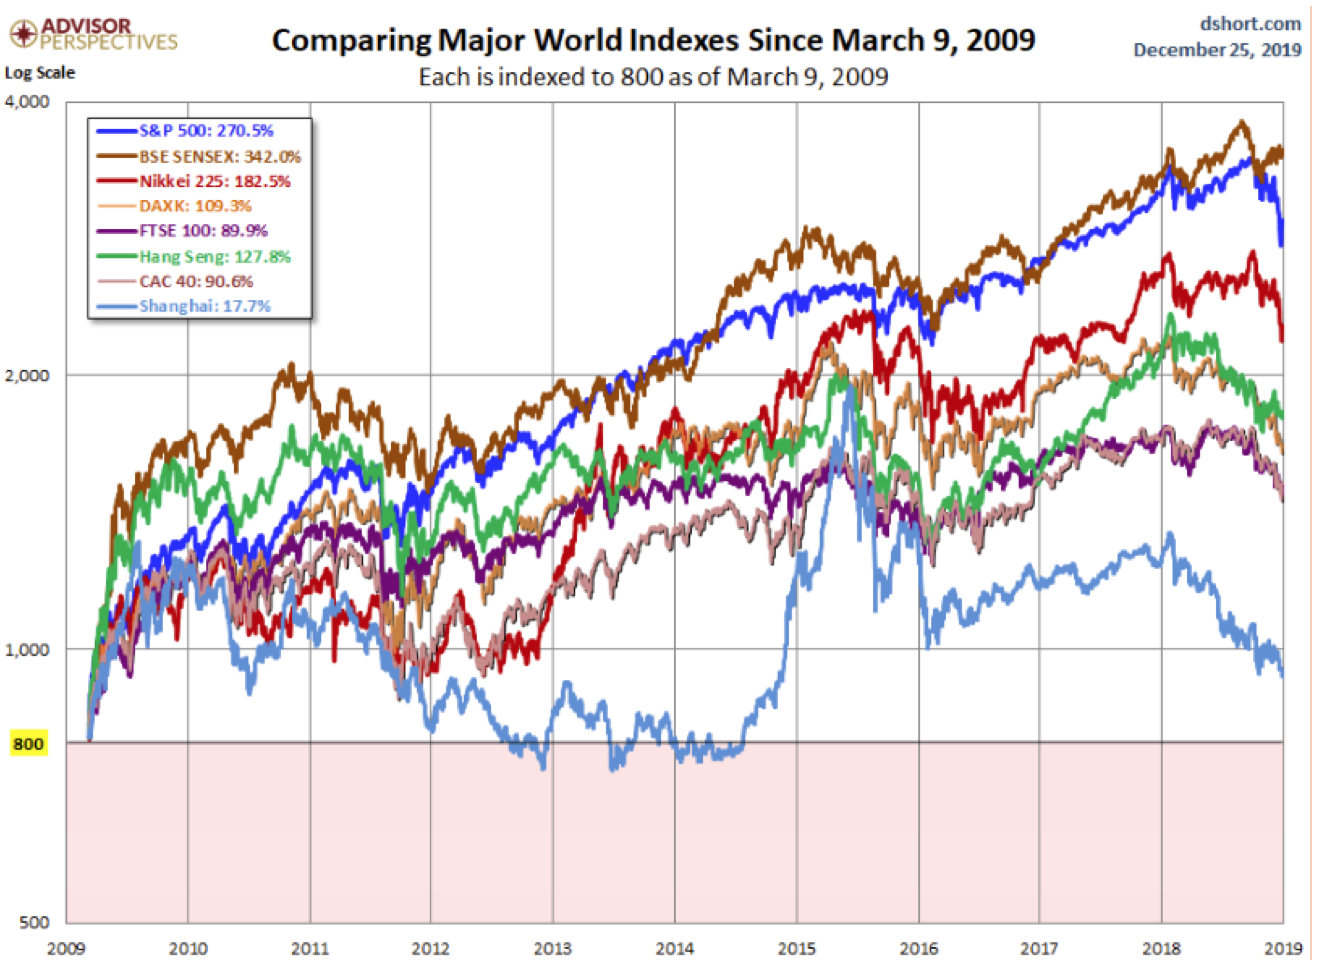
Comparing Major World Indexes Since March 9, 2009.png


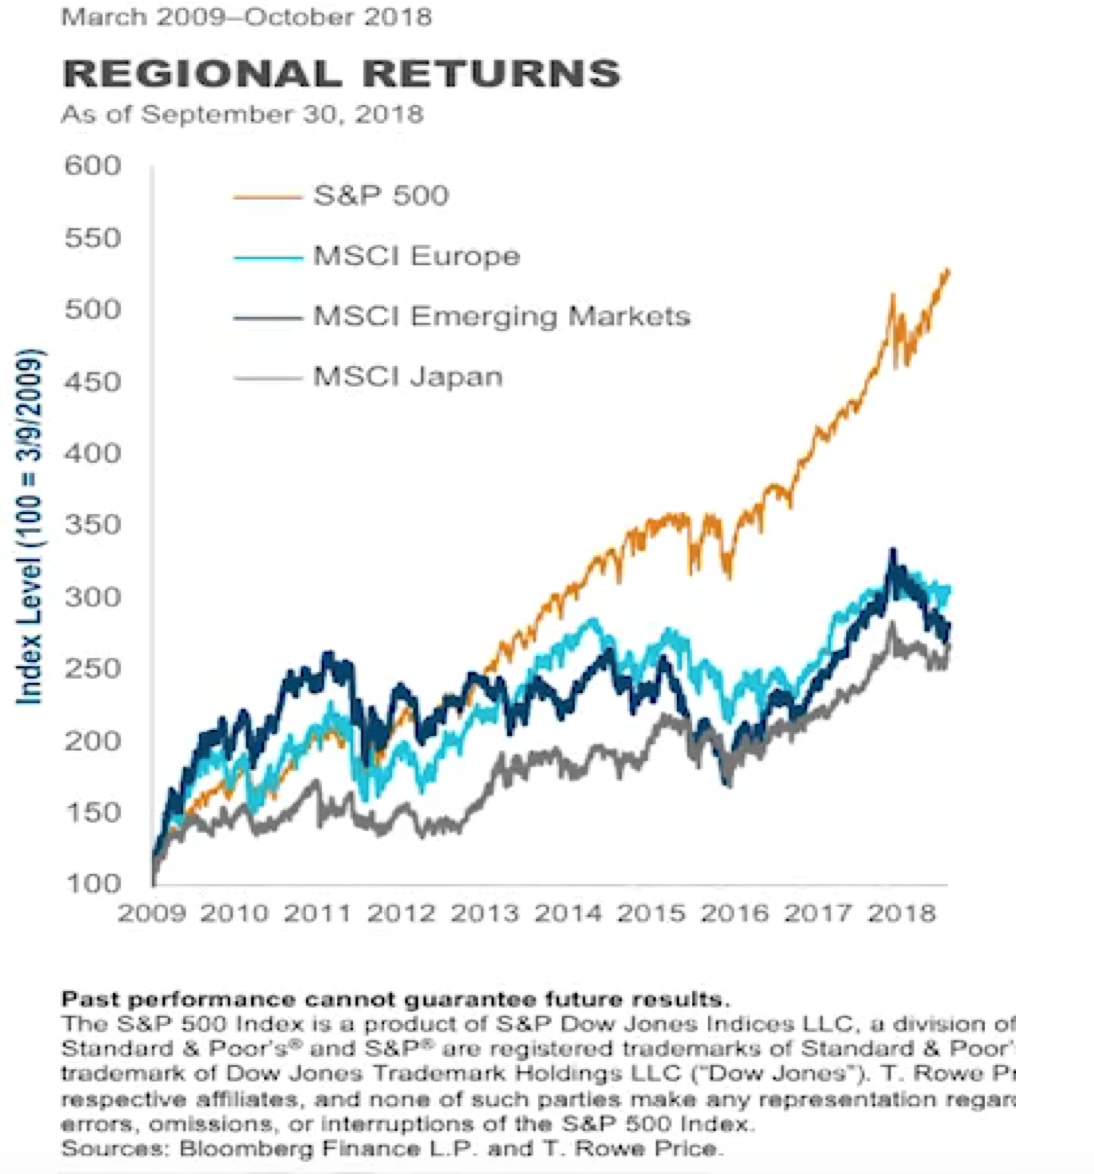
Regional Returns.png

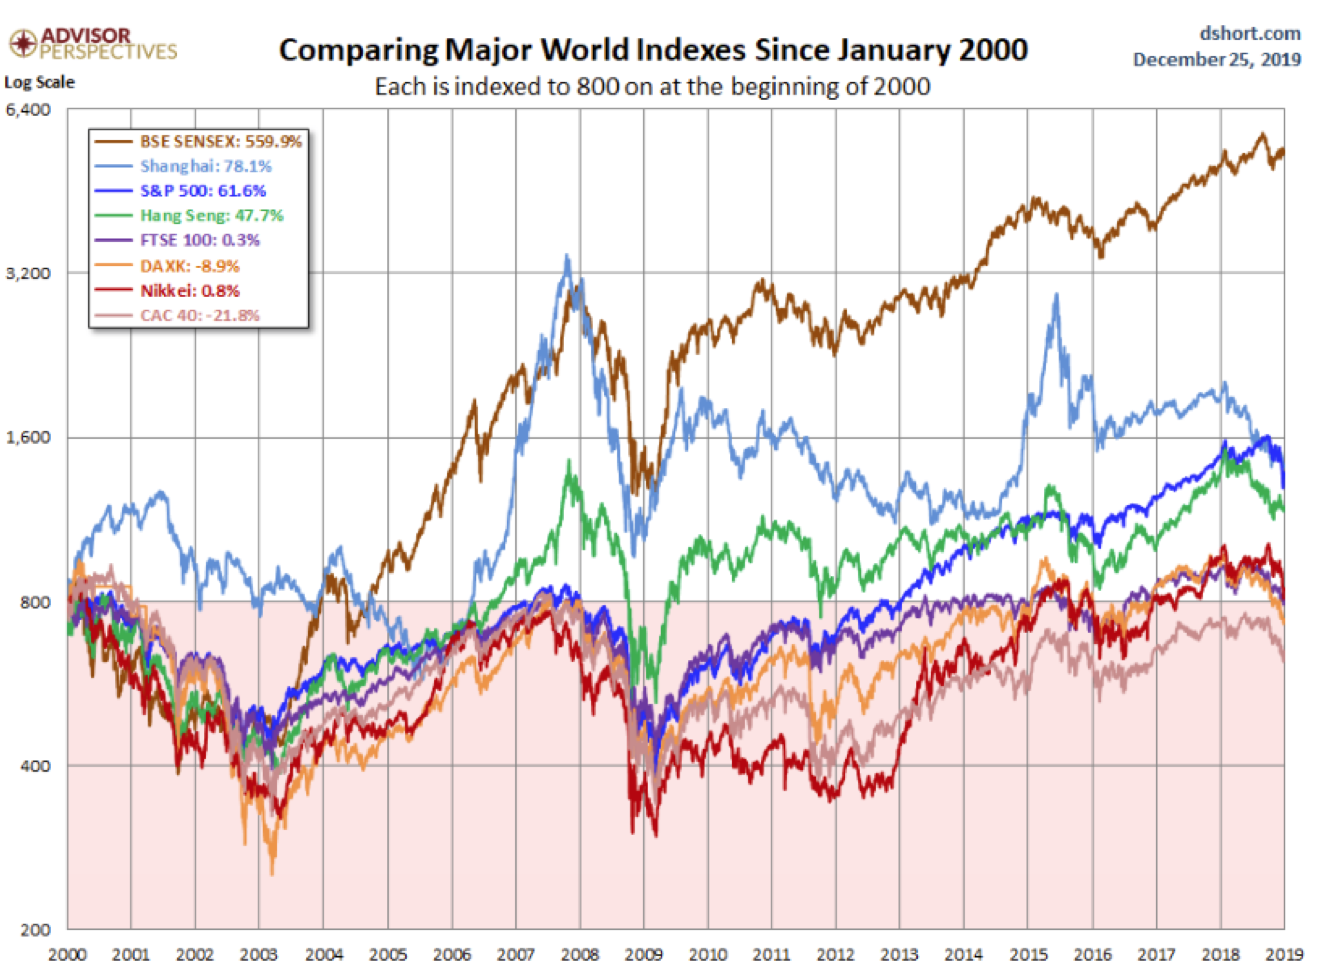
Comparing Major World Indexes Since January 2000.png

MSCI All Country World ex US and S&P 500 Indices Since 1997.png

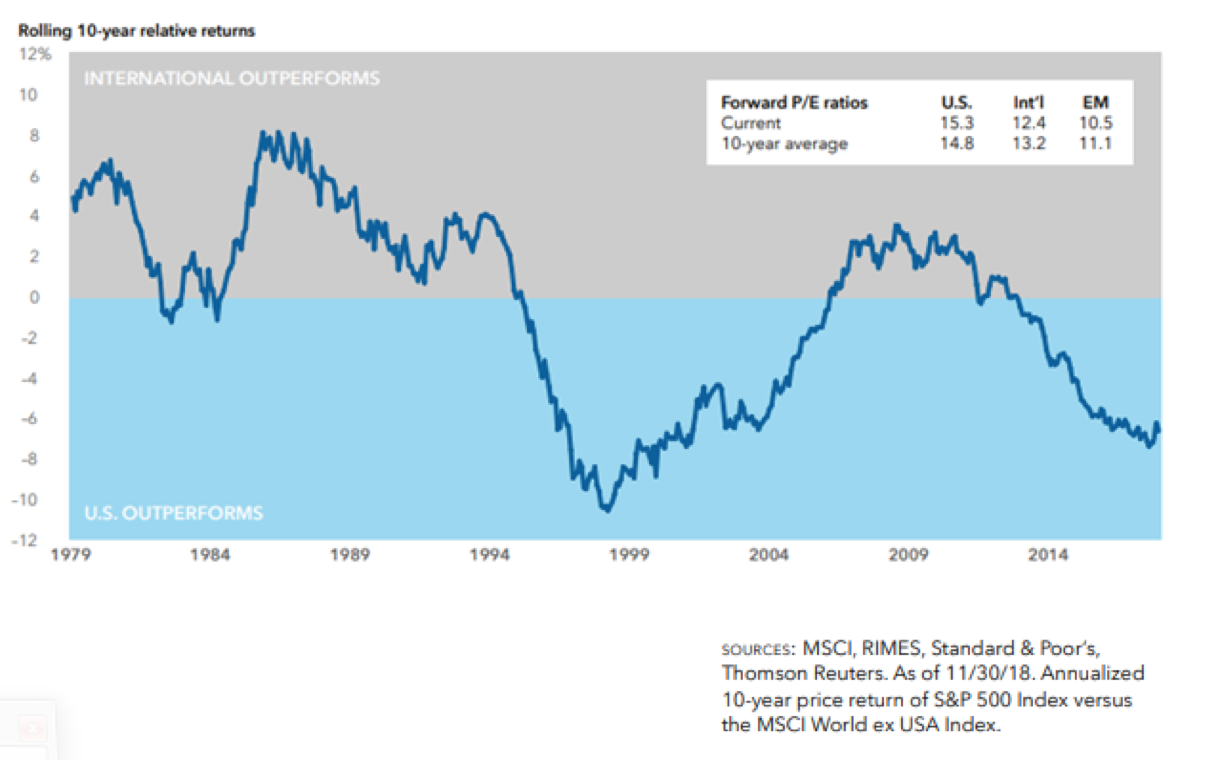
Rolling 10-Year Relative Returns Since 1979.png


II. U.S. Stocks and the S&P 500 Index: December 2018 was the worst December


S&P Composite Index.png

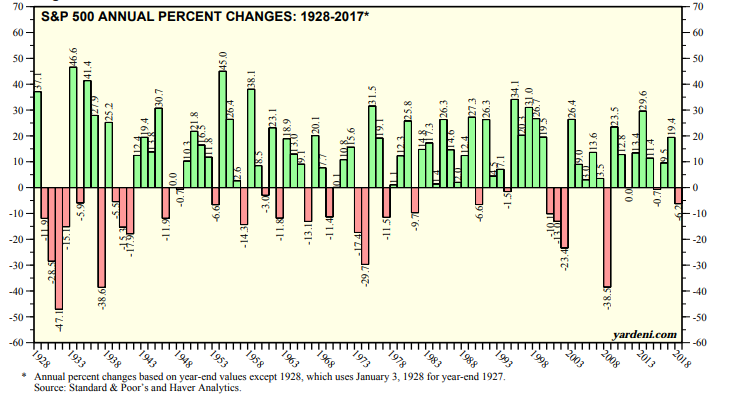
S&P500 Annual Percent change.png

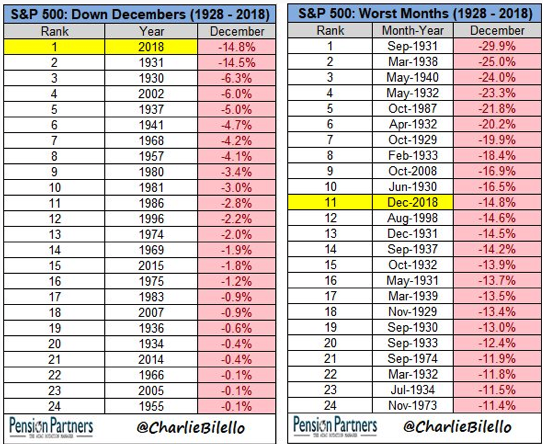
S&P 500 Down December and Worst months Since 1928.png

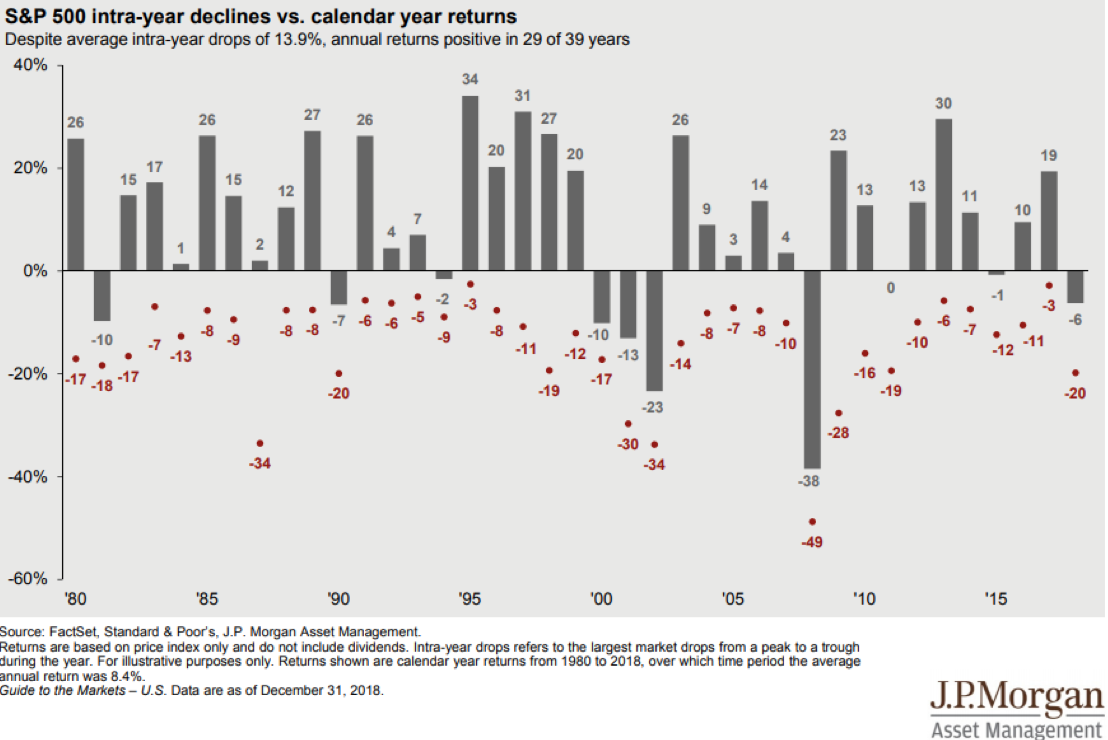
S&P 500 IntraYear Declines vs Calendar Year Returns Since 1980.png

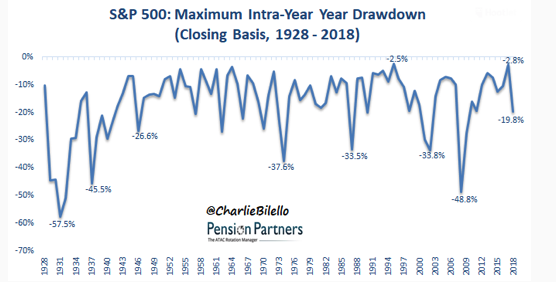
S&P 500 Maximum Intra-Year Year Drawdown Since 1928.png

S&P 500 Percent Off High Since March 9, 2009.PNG

S&P 500 Bear Markets Since 1929.png


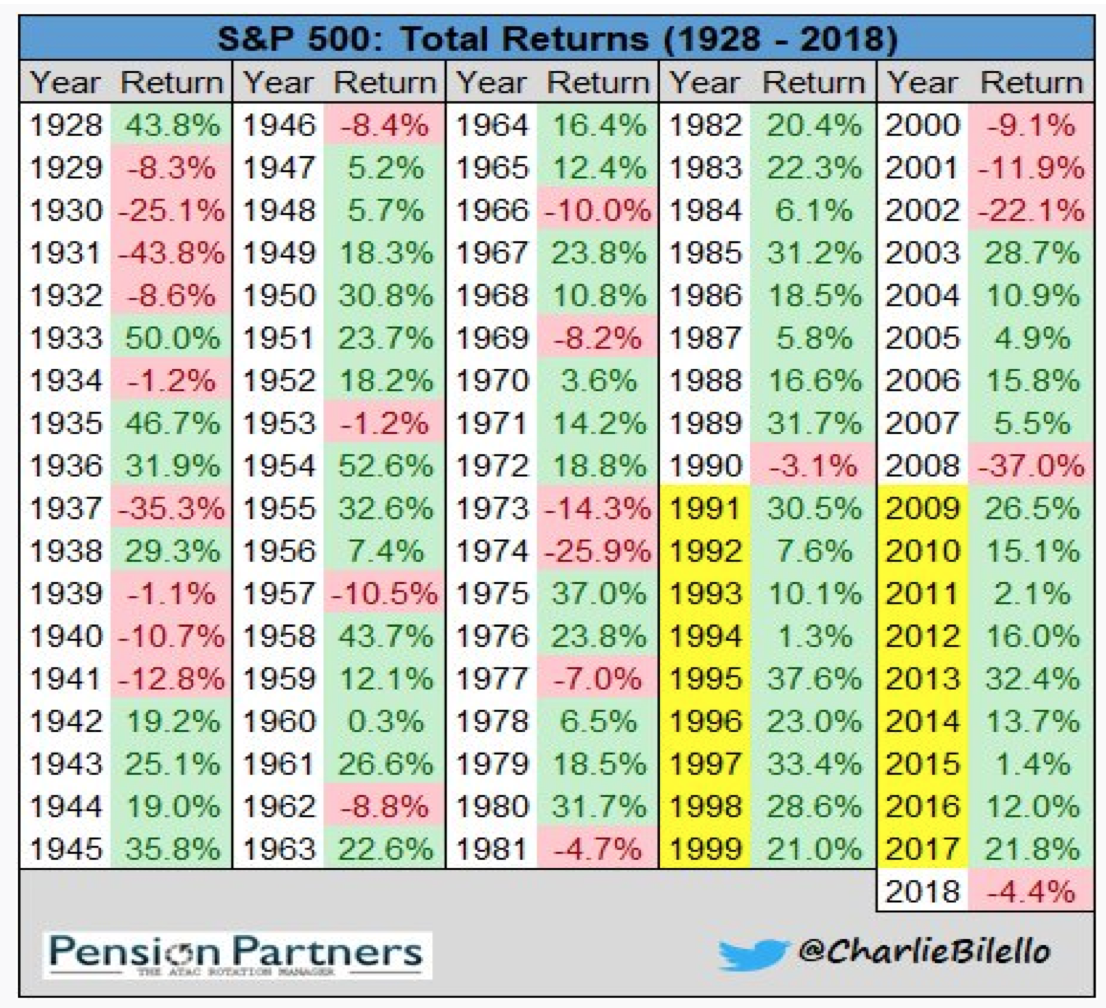
S&P 500 Total Returns Since 1928.png

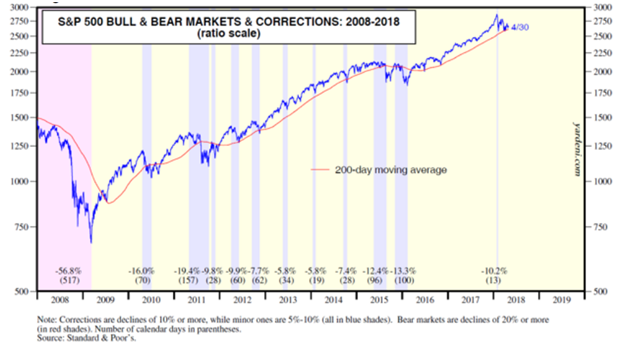
S&P 500 Bull And Bear Markets And Corrections.png

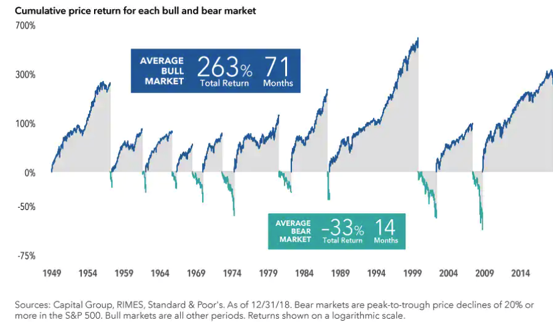
Cumulative Price Return for Each Bull and .png

Cumulative US GDP for Each Expansion and Recession Since 1950.png

Bull and Brea Market Averages Since 1900.PNG

Bear Markets Generally Occur Every 4 to 6 Years 1966-2017.PNG


III. Valuations: getting better
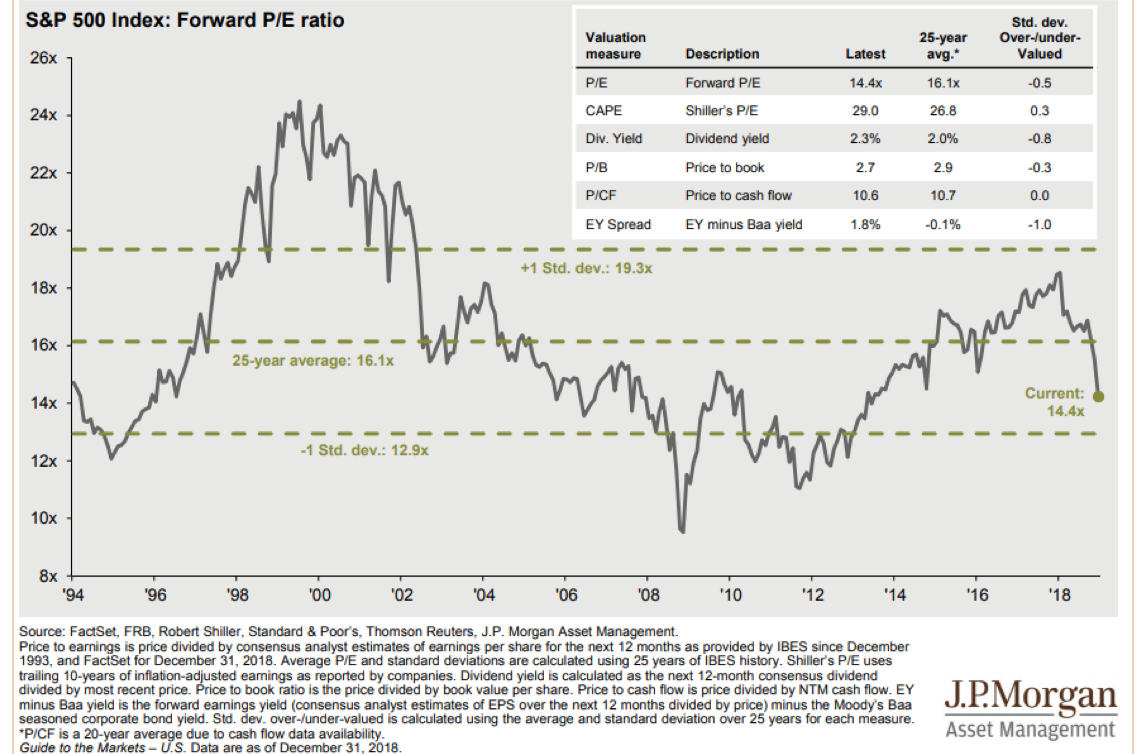


S&P 500 Index Forward PE Ratio Since 1994.png


S&P500 Reported Trailing.png

charts for a better perspective 2.jpg
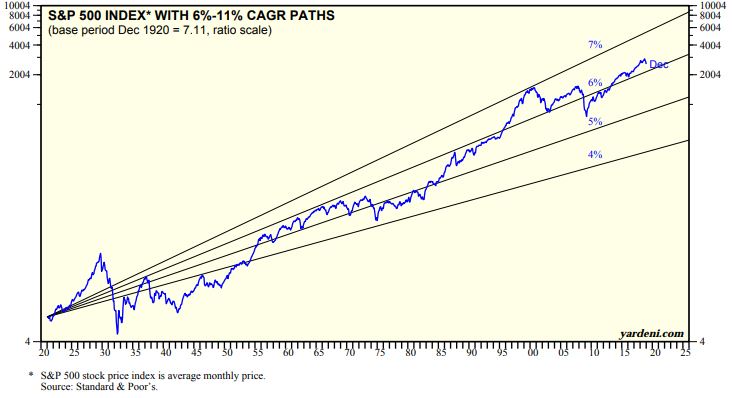
S&P Historical Composite_1871-Present Inflation-Adjusted Regression Channel Since 1870.PNG

Global Earnings and Valuations.png
charts for a better perspective 1.jpg
Stock Market Capitalization Ratio.png


IV. Economy: a recession in 2020-2021?


Length and strength of economic expansions since 1900.png

The Conference Board Leading Economic.png

U.S. dollar in historical perspective.png


Growth of $1 past Crisis 1930-2002.PNG

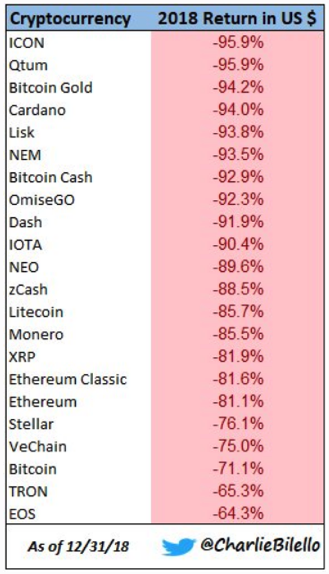
Cryptocurrency.png


is your portfolio recession proof 10.png


This newsletter was first published in January of 2019

https://mailchi.mp/bourbonfm/charts_for_better_perspective-1189517?e=3d347df708